
Understanding EC50, IC50, ED50, and Other Key Pharmacological Parameters
A practical guide to biological activity, enzyme kinetics, and binding measurements.
Introduction
Pharmacological activity is often summarized by a single number, yet these numbers describe different aspects of drug action. EC50 and IC50 quantify concentration-dependent functional responses; ED50, TD50 and LD50 relate to administered doses; Ki and Kd describe equilibrium properties under specified models; and Km characterizes enzyme kinetics. None of these values should be interpreted without the assay endpoint, experimental conditions and uncertainty.
| Parameter | What it describes | Typical unit |
|---|---|---|
| EC50 / IC50 | Concentration giving a half-maximal effect / 50% inhibition in a defined assay | M (nM, µM) |
| ED50 / TD50 / LD50 | Median effective, toxic or lethal dose | mg/kg |
| pIC50 | Negative log10 of IC50 in mol/L | unitless |
| Ki | Equilibrium inhibition constant within a mechanistic model | M |
| Km | Substrate concentration at half Vmax (Michaelis–Menten) | M |
| kon / koff | Association / dissociation rate constants | M−1 s−1 / s−1 |
| Kd / Ka | Equilibrium dissociation / association constant | M / M−1 |
1. EC50: half-maximal effective concentration
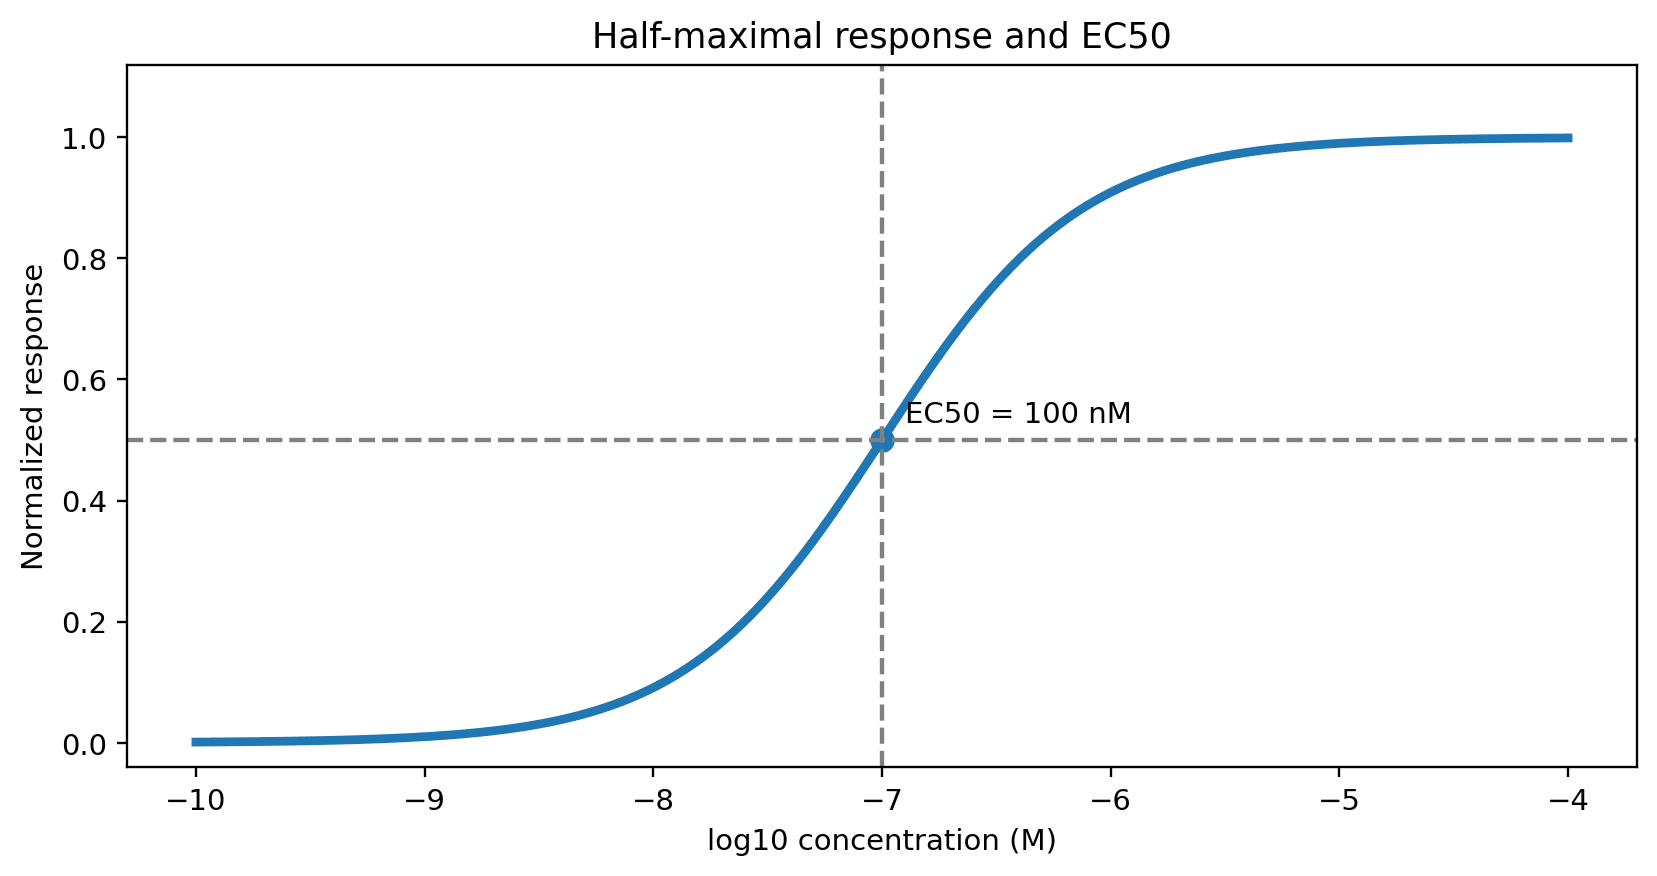
EC50 is the concentration that produces a response halfway between the fitted baseline and maximum response in a defined concentration–response assay. It is often used for receptor agonism, cell signaling, proliferation and other functional readouts. Importantly, EC50 is not restricted to activation: it can characterize any suitably defined concentration-dependent effect. A lower EC50 indicates greater potency only when compared under compatible conditions; it does not necessarily indicate greater maximal efficacy (Emax).
2. IC50 versus EC50
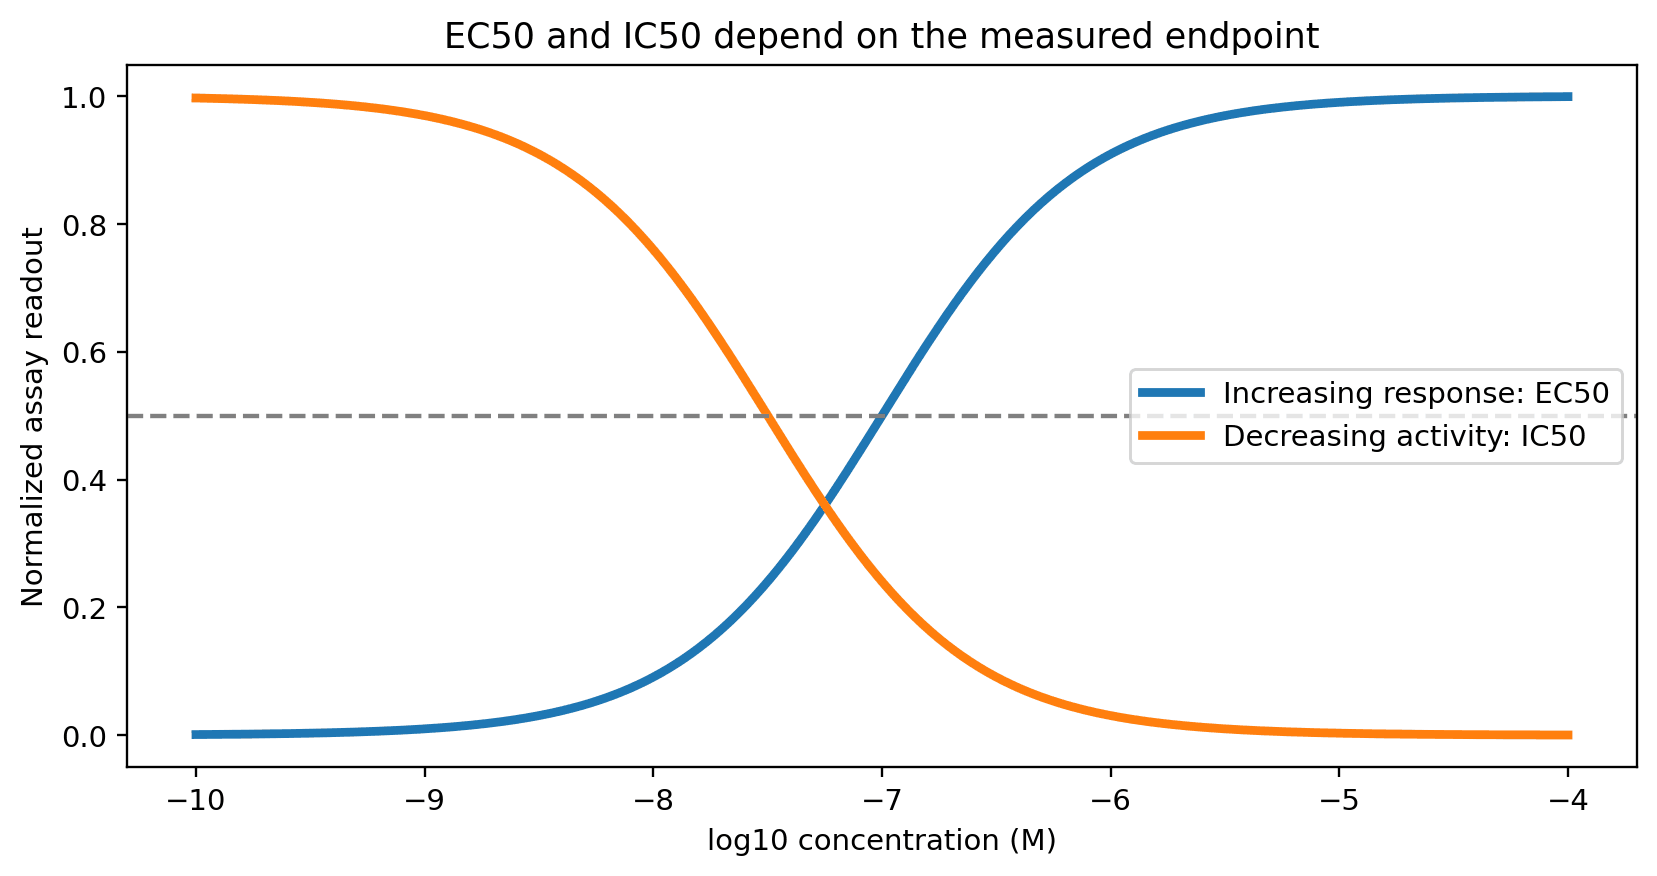
IC50 is the concentration associated with 50% inhibition of a specified activity relative to the assay's reference state. EC50 describes a half-maximal effect, which may be stimulatory or inhibitory. Thus the distinction depends on the biological endpoint and how the response is normalized, not simply on whether a compound is called an inhibitor or an activator. Both parameters are assay-dependent and should be reported with the model, replicate structure and confidence interval.
3. How to measure and fit an EC50
Prepare a dilution series spanning the expected transition region, include vehicle and appropriate positive/negative controls, and measure the biological response under a fixed exposure time.
For cell viability, cell proliferation and cytotoxicity endpoints, tetrazolium salt assays are among the most common readouts for EC50 and IC50 curves. In the MTT assay, Thiazolyl Blue (MTT) is reduced by NAD(P)H-dependent dehydrogenases in metabolically active cells to an insoluble purple formazan, which is dissolved (for example in DMSO) and measured at about 570 nm. WST-1 is a water-soluble tetrazolium salt that forms a soluble formazan, so no solubilization step is needed and absorbance is read at about 440–450 nm; this makes the WST-1 cell proliferation assay convenient for high-throughput 96-well dose–response screening. Both assays report metabolic activity, which is a proxy for viable cell number rather than a direct count, so test compounds that alter cellular metabolism or reduce tetrazolium salts directly should be checked with cell-free controls.
Correct for background and normalize responses according to the assay design. Fit a four-parameter logistic model by nonlinear regression, for an increasing response with positive HillSlope:
Y = Bottom + (Top − Bottom) / [1 + (EC50 / C)HillSlope]
Report the fitted EC50, units, confidence interval, top/bottom plateaus, replicate count and any fit limitations. Avoid interpreting an EC50 if the tested concentrations do not adequately cover the response transition.
4. Worked assay concept: DPPH radical scavenging
The source article discusses catechin in a DPPH radical-scavenging assay, reporting an EC50 of 7.74 µM for the cited study. In the described procedure, samples are mixed with a methanolic DPPH solution, incubated for 30 minutes protected from light, and absorbance is measured at 517 nm. A commonly used uncorrected calculation is:
Scavenging (%) = 100 × (Acontrol − Asample) / Acontrol
Colored or absorbing test compounds may require sample blanks and additional corrections. This is a cell-free chemical antioxidant assay, not a cell-cytotoxicity assay, and its EC50 should not be interpreted as evidence of in-vivo antioxidant efficacy.
5. ED50, TD50 and LD50
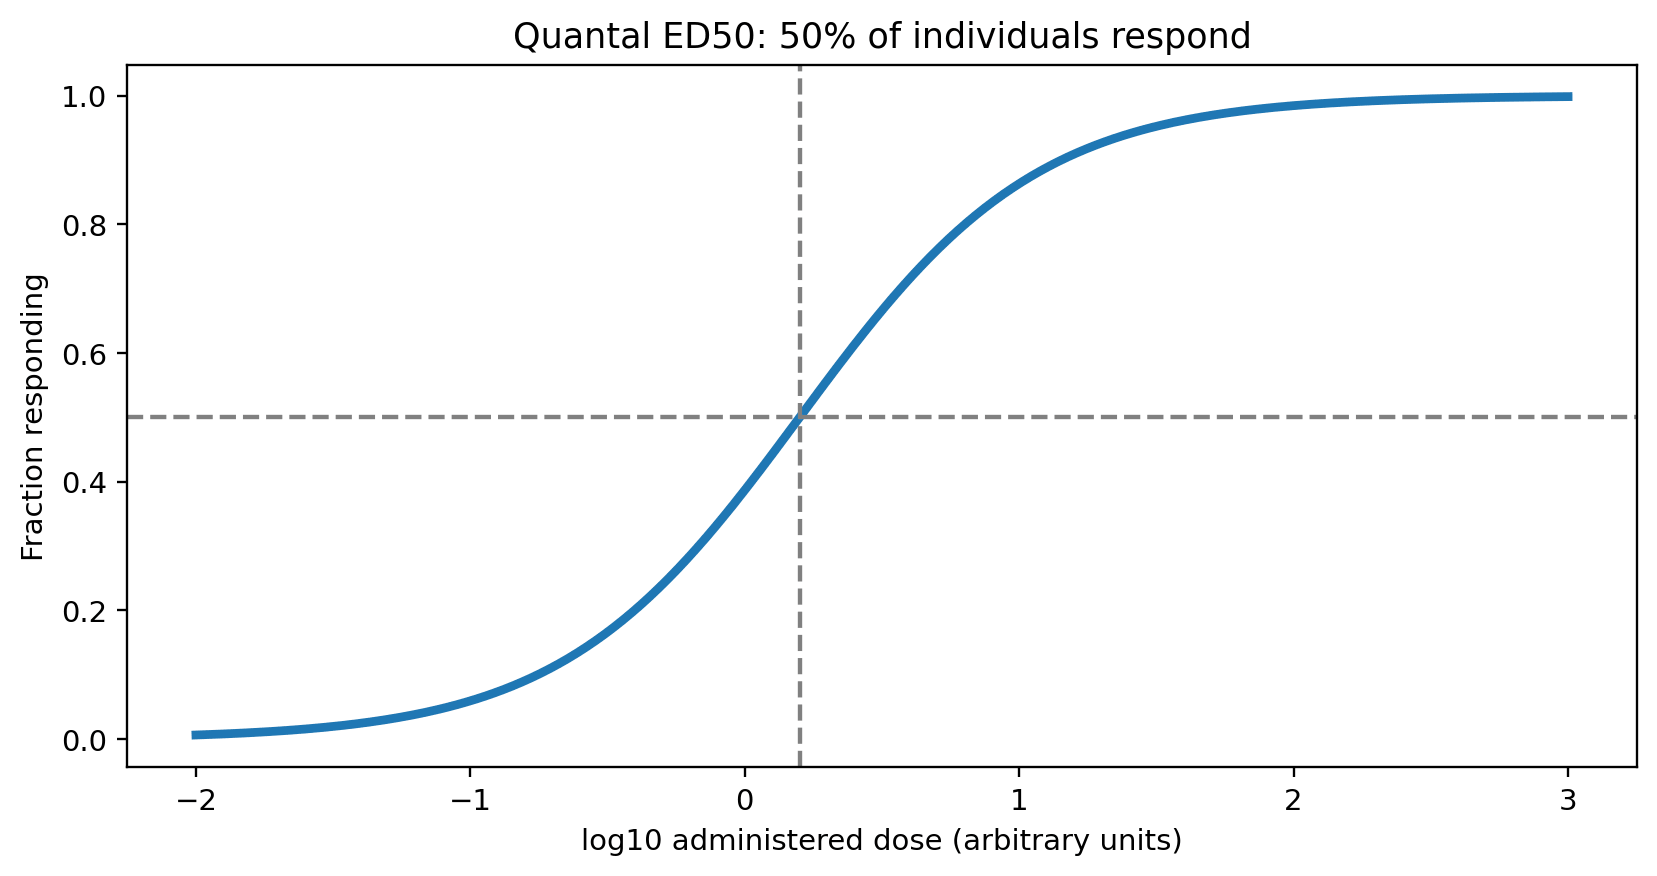
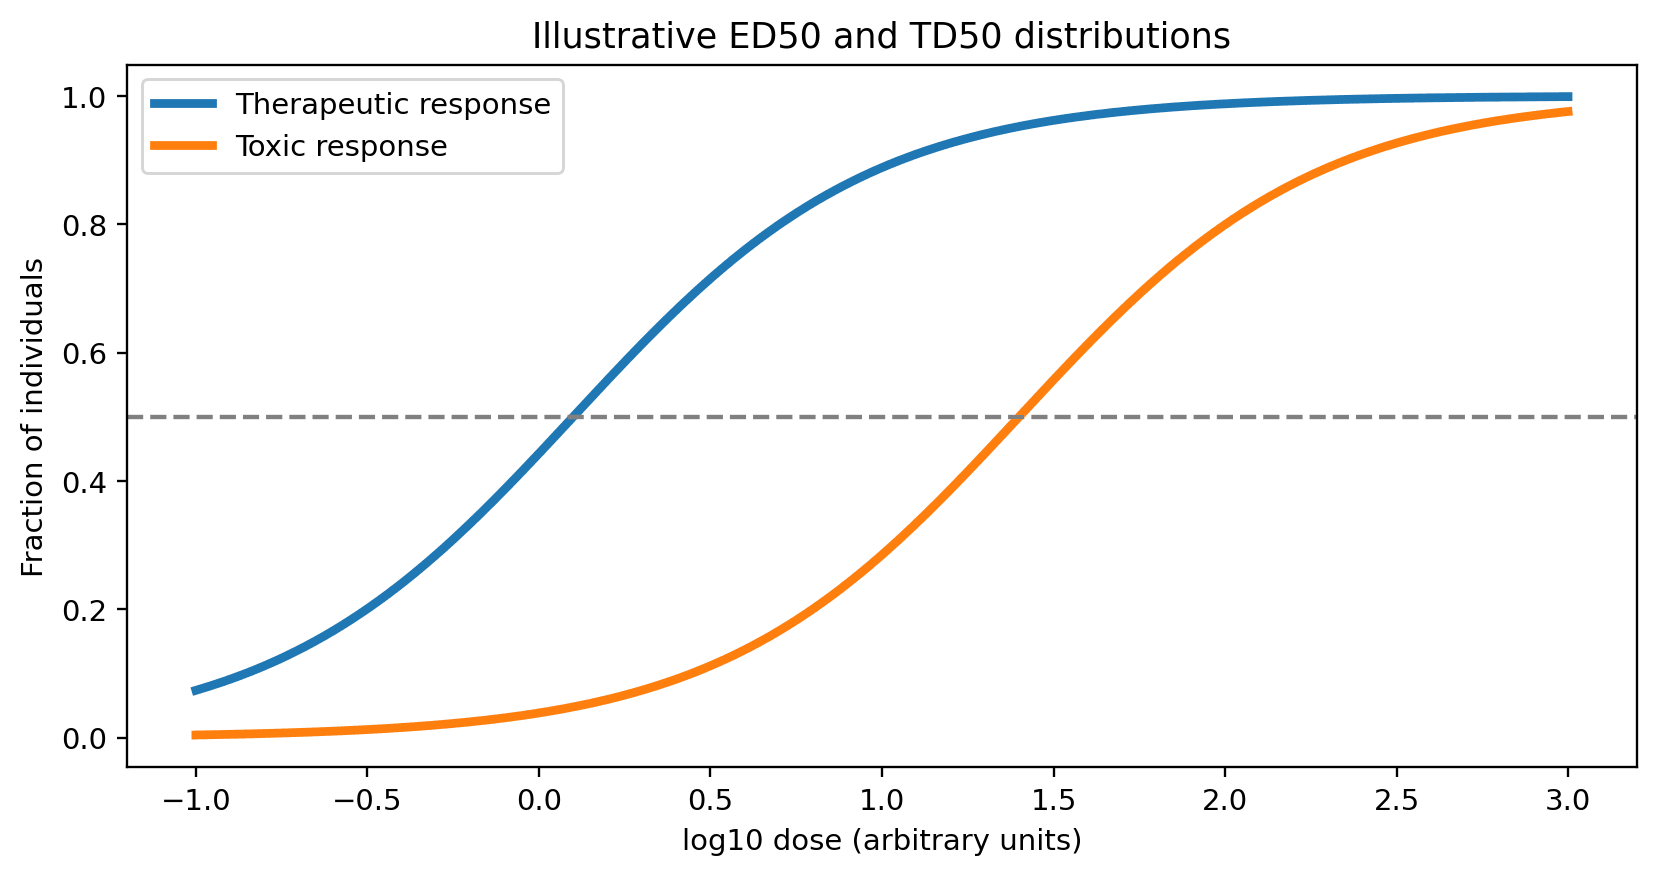
ED50 is a median effective dose, but the operational definition varies: in quantal studies it is the dose at which 50% of subjects meet a prespecified response criterion; in graded-response settings it can denote the dose producing half the maximal measured effect. TD50 is the dose causing a specified toxic outcome in 50% of subjects, while LD50 is the median lethal dose under defined experimental conditions. These are dose measures (for example mg/kg), unlike EC50 and IC50, which are concentrations. The ratio TD50/ED50 is sometimes called a therapeutic index, but it is an incomplete measure of clinical safety and depends strongly on endpoints and populations.
6. pIC50 and potency scales
pIC50 = −log10[IC50 in mol/L]
For example, an IC50 of 100 nM corresponds to pIC50 = 7. A higher pIC50 means a lower IC50. The logarithmic transformation facilitates comparisons but does not remove assay-dependent differences or experimental uncertainty.
7. Ki: inhibition constant
Ki is an equilibrium inhibition constant within a specified mechanistic model. For a simple reversible competitive inhibitor, the Cheng–Prusoff relationship may apply under its assumptions:
IC50 = Ki (1 + [S] / Km)
It should not be used indiscriminately for other inhibition mechanisms, tight-binding inhibitors or complex assays. Ki is not interchangeable with IC50. Its interpretation depends on the molecular mechanism and analysis method.
8. Km: Michaelis constant
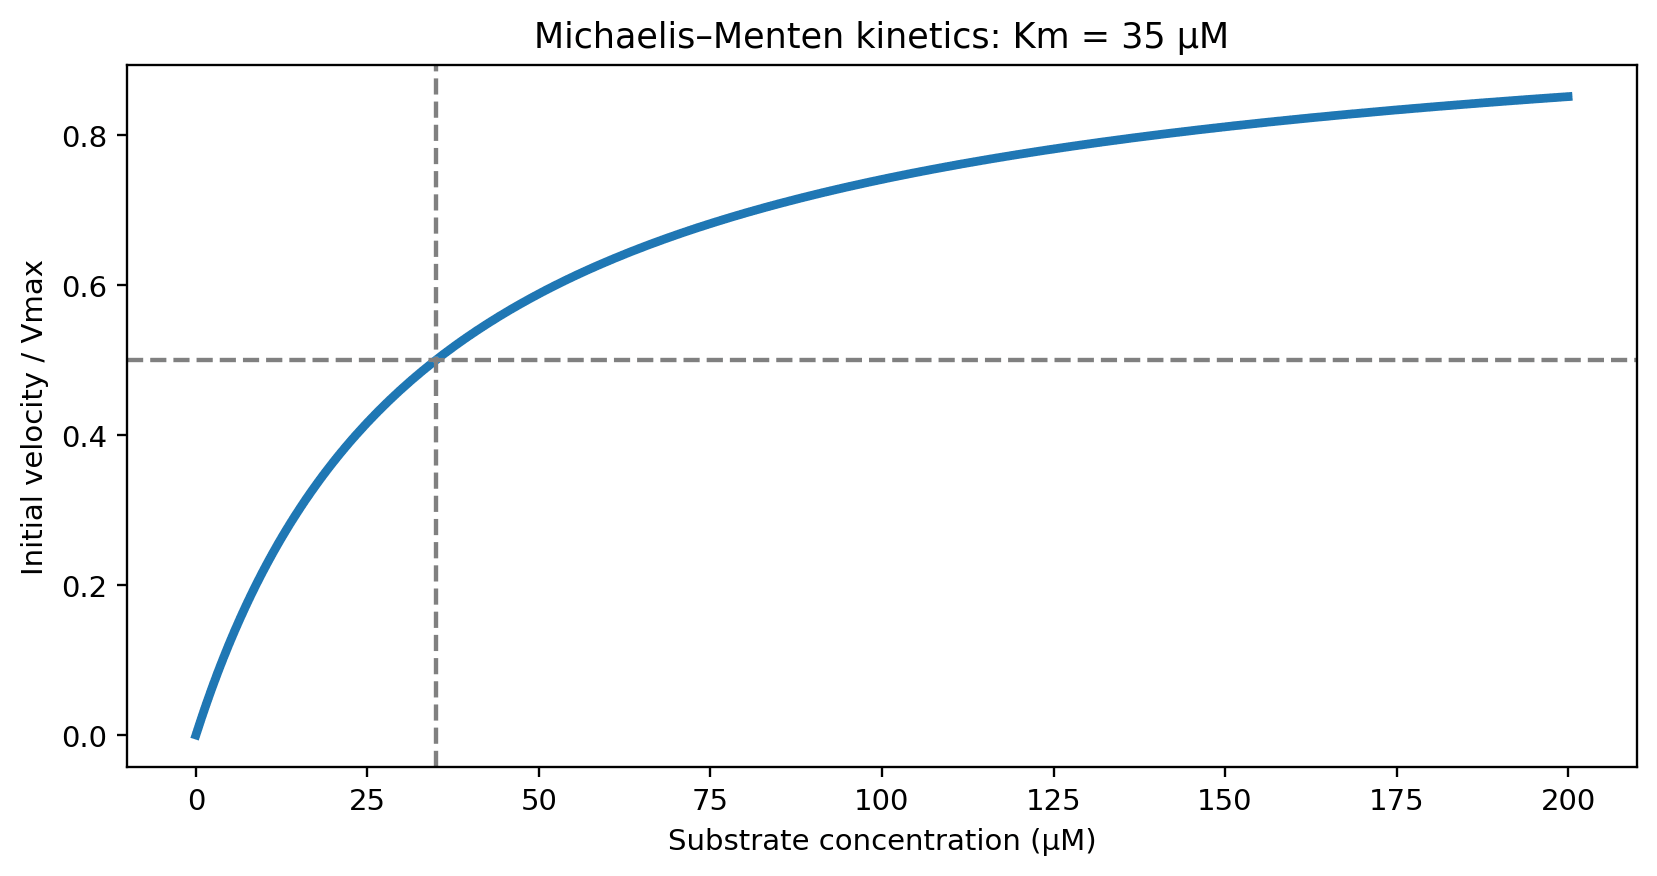
For an enzyme following Michaelis–Menten kinetics, initial velocity is:
v = Vmax [S] / (Km + [S])
so Km is the substrate concentration at which v = Vmax/2. Although Km is sometimes loosely described as affinity, it generally depends on multiple kinetic rate constants and is not necessarily the substrate dissociation constant. Nonlinear fitting of initial-rate data is usually preferable to reciprocal linear plots because the latter distort measurement error.
9. Binding kinetics: kon, koff, Kd and Ka
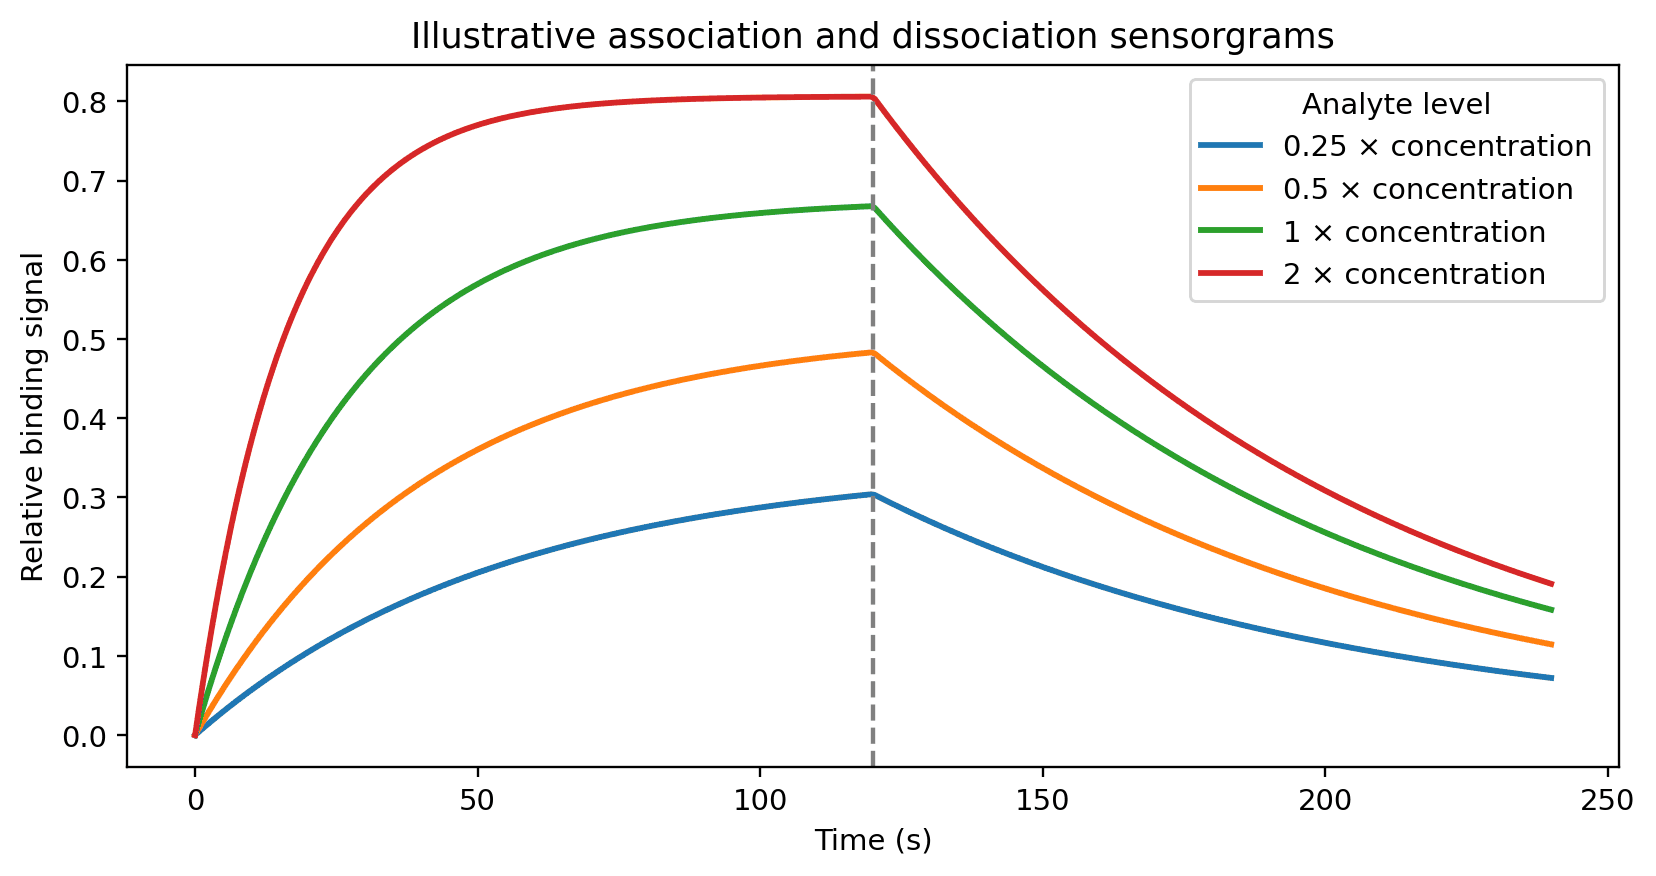
The association rate constant kon describes the rate of complex formation (typically M−1 s−1), while koff describes dissociation (s−1). For a simple 1:1 reversible binding model:
Kd = koff / kon (M) · Ka = 1 / Kd (M−1)
A smaller Kd indicates stronger equilibrium binding under comparable conditions, whereas koff influences residence time (approximately 1/koff for this simple model). Surface plasmon resonance, radioligand binding and suitable fluorescence-based methods can estimate these parameters, subject to model assumptions, mass transport, nonspecific binding and assay artifacts.
10. Practical interpretation and reporting
Before comparing published activity values, verify the biological system, substrate or ligand concentration, exposure duration, response normalization, fitting model, concentration units and uncertainty. Potency, maximal efficacy, binding affinity, kinetic residence time, toxicity and in-vivo exposure answer different questions. A strong candidate cannot be identified from a single potency metric alone.
Related reagents
| Product | Cat. No. | Typical use in this guide |
|---|---|---|
| Thiazolyl Blue (MTT) | A22425 | MTT cell viability and cytotoxicity assay; colorimetric readout at ~570 nm for EC50/IC50 curves |
| WST-1 | A24910 | WST-1 cell proliferation assay; water-soluble formazan read at ~440–450 nm, no solubilization step |
| DPPH | A24654 | Cell-free radical-scavenging (antioxidant) assay |
| Catechin | A12029 | Reference antioxidant in the DPPH example |
Related reading: How to Choose an Inhibitor Supplier: The Complete Evaluation Guide
References
- Watts SW, et al. How New Developments in Pharmacology Receptor Theory Are Changing (Our Understanding of) Hypertension Therapy. Am J Hypertens. 2024;37:248–260. PMC10941088
- Zaman A, et al. Quantitative Framework for Bench-to-Bedside Cancer Research. Cancers. 2022;14:5254. PMC9658824
- Chen Z, et al. EC50 estimation of antioxidant activity in DPPH assay using several statistical programs. Food Chem. 2013;138:414–420.
All figures are schematic illustrations generated from simulated data. All Adooq products are for research use only.